HHS current hospitalization data is always available here:
https://protect-public.hhs.gov/pages/hospital-capacity
On 11/23/2020 it shows 60.62% ICU occupancy across the US (not just covid ICU).
[ UPDATE: 12/4/2020 shows 60.14% ICU occupancy ]
[ UPDATE: 12/9/2020 shows 63.57% ICU occupancy ]
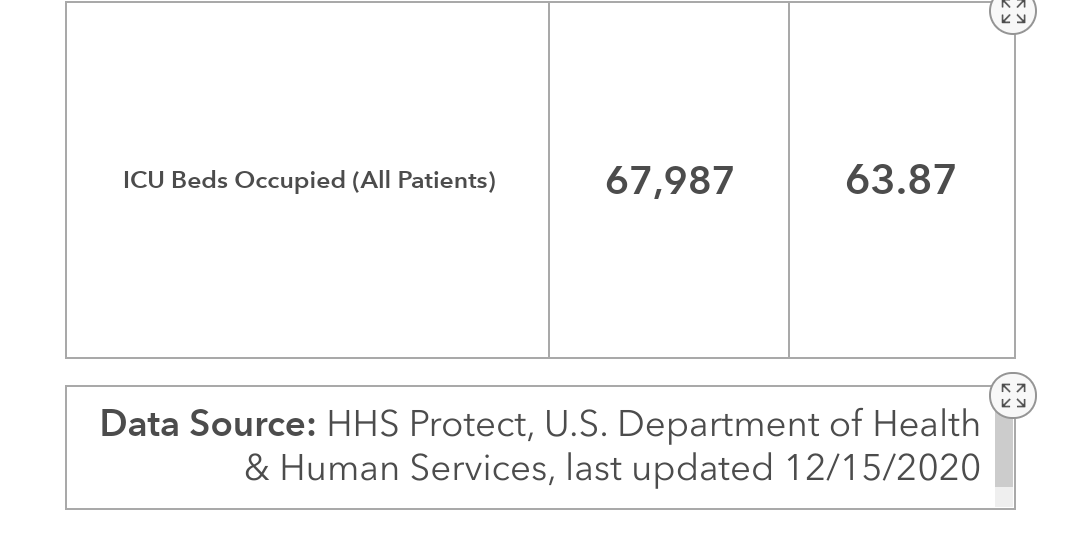
[ UPDATE: 12/15/2020 shows 63.87% ICU occupancy ]
[ UPDATE: 12/29/2020 shows 61.15% ICU occupancy ]
[ UPDATE: 1/4/2020 shows 63.18% ICU occupancy ]
The map shows state by state breakdowns.
Check back often…
Note: You may also Google NY Times ICU occupancy to check your local stats.
https://www.nytimes.com/interactive/2020/us/covid-hospitals-near-you.html
However, the Times acquires their figures from the HHS. The HHS website link is provided above.
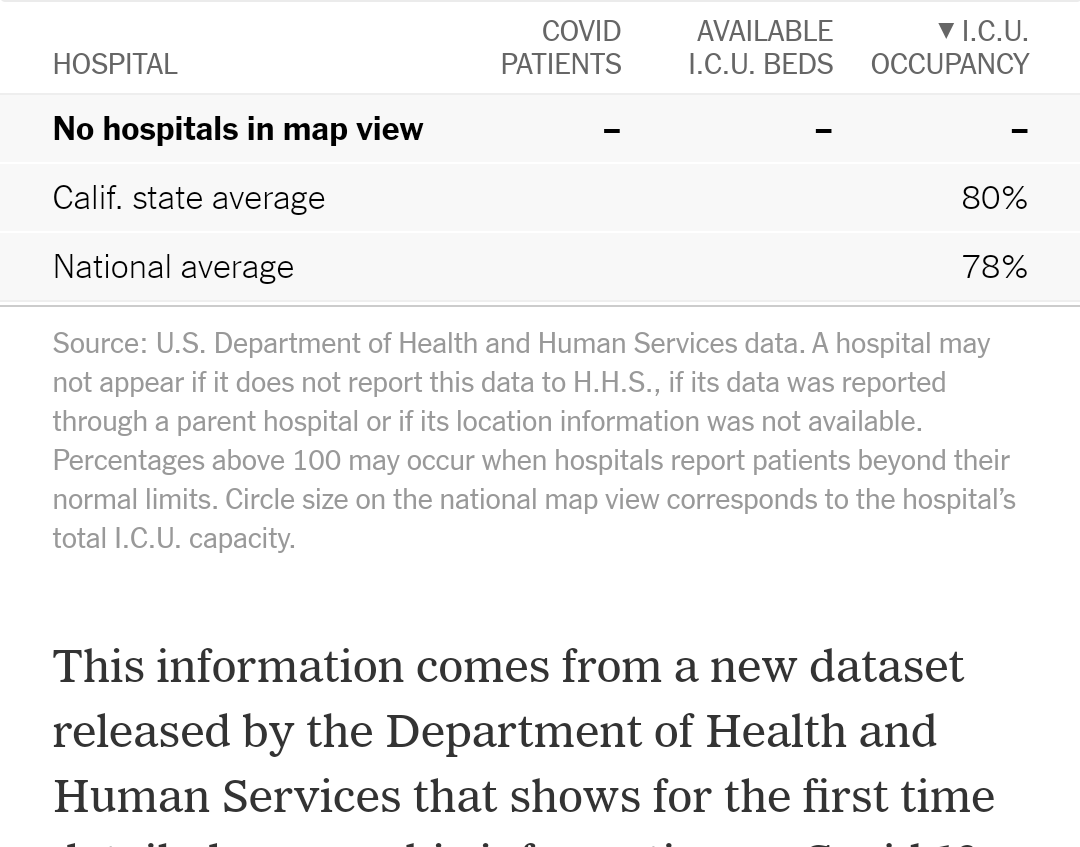
When I checked today the Times’ estimated national ICU occupancy figure (levels reported over the seven days from Dec. 4 through Dec. 10)
************

************
was 14.13% higher than HHS Data Hub’s national ICU occupancy.


(Perhaps one or the other has not recently updated.)